THE ENVIRONMENT
How we build Environmental Capital
It is an inescapable fact that our business activities have significant impacts on the environment. Our operations make use of water, recyclable and non-recyclable materials, produce emissions and waste and also utilize large amounts of energy. Therefore we have a responsibility to utilize these inputs responsibly and have systems in place to manage, recycle where possible and properly dispose of waste materials. Any failure to consider the effects that our business operations have on the environment would result in our business continuity being adversely affected, due to breaches of environmental regulations and also due to the negative impact on the livelihoods of local communities.
This is why we have instituted an Environmental Management System which carries the ISO 140001 (2004) certification. Our Environmental Management System (EMS) enables us to measure the impact of our operations on the environment and facilitates timely mitigation of any risks identified. Hands-on supervision and management of this system is enabled through our Sustainability Committee and Group Management Committee. These forums provide platforms for the open discussion of issues pertaining to environmental sustainability and for the formulation of related policies and strategies. In directing the implementation of our Environmental Management Strategies across the Group, the Group Management Committee and the Sustainability Committee ensure that our EMS guidelines are complied with and practiced. Additionally, senior management delegates specific responsibilities for the management of environmental issues to their respective business units.
The Dimo Nature Club supports all these efforts; a voluntary initiative which is open to all members of the Dimo Group and is focused on protecting the environment.
Based on the issues and concerns raised by our stakeholders, we have identified the following six critical areas that require environmental management and supervision.
- The management of atmospheric emissions and climate change
- Energy and fuel management
- Water management
- Waste management
- Materials management
- Noise management
EMISSION MANAGEMENT
We have taken steps to measure and manage our emission levels as we are very conscious of the fact that there is a significant impact to stakeholders caused by emissions. Even though measuring and managing this would not directly affect our cost structure, we have used our stakeholder engagement mechanisms to learn that local communities would be affected in the long run by such emissions, which would be a negative impact on our social licence to operate.
Moreover, climate change concerns and the growing concerns regarding the use and availability of carbon-based fuels affect our stakeholders and our operations respectively.
The greenhouse gas (GHG) emitted into the atmosphere by the activities of Dimo is carbon dioxide (CO2). Based on our commitment to addressing climate change in a positive manner, our strategy is to initiate solutions such as the reduction of fuel useage in order to reduce our GHG gas emissions by a significant percentage. We identified the need to calculate our GHG emissions 6 years ago and we continue to update our measurements.
The methodology of measurement follows the WBCSD/WRI Greenhouse Gas Protocol’s Corporate Standard (Revised Edition). The organisational boundary comprises all entities of the Dimo Group, encompassing operations in all parts of the country. Reporting is primarily under Scopes 1 and 2 with some elements of the optional Scope 3, according to data availability.
Carbon foot print calculation
|
Description |
Measurement |
2013-2014 |
2012/13 |
2011/12 |
Emission intensity ratio ( tCO2e per Rs. 1 mn of Group net turnover) |
Conversion Factor |
||||
Consumption by type |
tCO2 e emission |
Consumption by type |
tCO2 e emission |
Consumption by type |
tCO2 e emission |
|||||
Scope 1 |
|
|
3,741 |
|
|
|
|
0.1792 |
||
Diesel for vehicles |
Ltr |
501,413 |
1,325 |
458,784 |
1,213 |
471,923 |
1,247 |
|
2.67 |
|
Diesel for generators |
Ltr |
8,142 |
22 |
13,788 |
36 |
3,389 |
9 |
|
2.67 |
|
Petrol for vehicles |
Ltr |
495,536 |
1,143 |
440,875 |
1,165 |
378,114 |
872 |
|
2.33 |
|
Gas |
Kg |
7,463 |
16 |
7,475 |
16 |
7,138 |
16 |
|
2.20 |
|
Diesel for vehicle delivery to customer and service processes |
Ltr |
448,656 |
1,186 |
643,525 |
1,701 |
1,030,789 |
2,724 |
|
2.67 |
|
Petrol for vehicle delivery to customer and service processes |
Ltr |
21,093 |
49 |
27,653 |
73 |
40,298 |
93 |
|
2.67 |
|
Scope 2 |
|
|
1,488 |
|
|
|
|
0.0712 |
|
|
Electricity |
Kwh |
2,210,305 |
1,488 |
2,619,380 |
1,763 |
2,227,384 |
1,514 |
|
|
0.68 |
Scope 3 |
|
|
539 |
|
|
|
|
0.0258 |
|
|
Fuel utilised by outsourced party - Diesel |
Ltr |
94,257 |
249 |
99,159 |
262 |
62,889 |
167 |
|
2.67 |
|
Fuel utilised by outsourced party - Petrol |
|
10,573 |
24 |
8,613 |
20 |
6,804 |
16 |
|
2.33 |
|
Business Travel |
CO2 |
|
266 |
|
220 |
|
119 |
|
actual |
|
tCO₂e |
5,768 |
6,469 |
6,777 |
0.2762 |
|
|||||
(Note-Fuel consumption for vehicle delivery to customer location is considered under scope-1)
The 7.7 % reduction in our total carbon footprint due to a reduction of diesel consumption for delivery vehicles as we streamlined our processes and our electricity consumption.
Direct GHG emissions from diesel for vehicles, vehicle delivery and service processes amounted to 2,511 tCO2e (2,914 tCO2e in 2012/13), which comprised 43% (47% last year) of our total carbon footprint. When compared against an activity level, our GHG emissions during the year under review increased to 0.2762 tCO2e per Rs. 1 mn of Group net turnover, compared with 0.2218 tCO2e recorded last year. This increase may be attributed to a reduction in turnover of 25% in comparison with the previous year,
We are committed to the refinement and expansion of our scope of reporting in the year ahead; our ultimate objective being to achieve a substantial reduction of our carbon footprint.
Managing Atmospheric Emissions
Monitoring is a quarterly exercise complying with tolerance levels regulated by the Central Environmental Authority or CEA. Our emission levels remain lower than the tolerance levels required by the CEA and there have been no air emissions of NOx and SO2 attributable to our activities.
DIMO has installed exhaust gas and dust extractors in stipulated areas, which deal effectively with emissions typically emanating from engine testing and the cleaning of air filters and brake assemblies. Our paint booths incorporate filtration systems that prevent the release of toxic fumes and particles into the atmosphere.
The company ensures that exhaust extractors at all locations capture the carbon dioxide (CO₂) and diesel fumes that are emitted. These fumes are extracted into a machine, and released into the environment within the legally permissible limit. The Group’s activities do not result in significant emissions of ozone depleting emissions. Even our use of CFC-free gases in vehicles and air-conditioning at plants have built-in systems to capture and recycle gases when the units are serviced. ODS gas from air-conditioning units is recycled in special machines to avoid leakage into the environment.
MATERIALS – USAGE, RECYCLING AND RE-USE
By the nature our business activities we use substantial amounts of materials in our vehicle repair, servicing, mechanical systems installation and after-sales services. The continuous measurement and management of the types and amounts of materials used by us help us cut costs and also ensure that we use recyclable materials as much as possible. Such measurements would also help us ensure that these materials are stored, used and disposed of as per the guidelines in our Environmental Management System. Material waste is handed over to third parties for recycling. Currently, we do not siginificant amount of recyled material for our service processes
Type of Material used |
Measurement |
Quantity |
||
2013/14 |
2012/13 |
2011/2012 |
||
Paints |
Lt |
8,016 |
7,563 |
2,281 |
Kerosene |
Lt |
39,607 |
41,228 |
48,619 |
Lubricants * |
Lt |
188,281 |
253,073 |
209,769 |
No. of tyres re-treaded |
Nos. |
824 |
1,312 |
1,444 |
Floor Carpets |
Nos. |
35,980 |
59,000 |
45,200 |
Cotton Waste |
Kg |
24,818 |
29,625 |
18,000 |
Lacquer |
Lt |
242 |
471 |
452 |
Thinner |
Lt |
16,156 |
19,050 |
7,492 |
Putty |
Kg |
211 |
237 |
142 |
Filler |
Lt |
1,267 |
1,016 |
191 |
The methods of disposal of materials used and waste materials are discussed further in the Waste Management section below.
ENERGY MANAGEMENT
The scale and range of our business activities mean that we consume a significant amount of energy. This has to be measured and managed as our energy consumption has a significant impact on our costs and also stands as an indicator of the efficiency of our internal service-related processes. Moreover, our energy usage has significant long term impacts on the environment as we chiefly utilize fossil fuels
The main sources of energy for the Group are electricity, LP gas and diesel and petrol for the vehicles used internally. Virtually all our electricity needs are met by the national grid and a small amount of electricity is generated for contingencies through in-house generators located at all our business centres. A small amount of LP gas is used for the staff cafeteria activities and at the workshops.
Using conversion factors from reputable and authoritative sources, we determine the energy consumption in GJs. The factors follow the Kyoto Protocol and UNFCCC Charter as closely as possible. Each factor originates from a reputable source, which is updated annually.
In-house energy consumption
Description |
units |
|
Consumption |
||
2013/14 |
Energy intensity ratio from fulltime employee |
2012/13 |
2011/2012 |
||
Diesel for Vehicles |
GJ |
27,210 |
17.91 |
34,703 |
55,858 |
Diesel for Generators # |
GJ |
306 |
0.20 |
654 |
82 |
Petrol for Vehicles |
GJ |
16,516 |
10.21 |
15,412 |
13,835 |
LP Gas |
GJ |
344 |
0.23 |
349 |
328 |
Electricity |
GJ |
7,957 |
5.28 |
9,429 |
8,081 |
Total |
52,333 |
34.45 |
60,547 |
78,184 |
|
# Direct Energy Consumption
* Indirect Energy Consumption
Consequent to the reduction by 20% of diesel fuel used for customer deliveries, energy consumption for the year under review reduced by 13 %. This consumption has reduced as a consequence of a drop in sales volumes during 2013/14 whilst a procedure was in place to strictly monitor fuel consumed for vehicle deliveries, by streamlining such activities. Petrol consumption increased by 7% due to an increase in sales promotion activities. Electricity consumption however, decreased by 14 % due to the reduction of turnover.
External energy consumption
Source |
Units |
Consumption |
|
||
Diesel used for customer delivery and customer vehicle |
GJ |
8,540 |
Petrol used for customer delivery and customer vehicle |
GJ |
565 |
Fuel utilised by outsourced party - Diesel |
GJ |
3,547 |
Fuel utilised by outsourced party - Petrol |
GJ |
350 |
Total |
13,002 |
Energy Audits, Energy Efficiency and Conservation
We are a company that is accredited by the Sri Lanka Sustainable Energy Authority to conduct energy diagnosis and audits. DIMO conducts such energy audits both in-house as well as externally as an on-going exercise. The findings in respect of internal energy audits, serve to highlight areas where we can minimise waste and where we could improve energy efficiency. Measures highlighted and implemented included the use of capacitor banks for power factor correction, the replacement of incandescent lighting with CFL and LED technology (almost all areas of the Group have been converted), programming all computers to revert to standby mode within a 5 minute idling period, setting air conditioning units at a constant minimum of 24 °C or over and inculcating a culture amongst the staff of ‘switching it off’ – turning off lights, computers and taps when not in use. New buildings make maximum use of natural lighting in their design and adopt energy efficient building codes.
Energy Efficient Products
Energy efficiency is amply reflected in our product range too. The Dimo Batta light truck and the TATA Nano car are amongst the most fuel-efficient vehicles on the roads of Sri Lanka today. At the other end of the scale, our luxury Mercedes Benz range now incorporates Blue Efficiency Technology that has made them even more fuel thrifty.
Our lighting division markets the Osram range of LED and CFL energy saver bulbs and also offers its expertise in conducting energy audits for external parties. Initiatives will be taken to mesure the energy savings that could be realised through the usage of the above mentioned products.
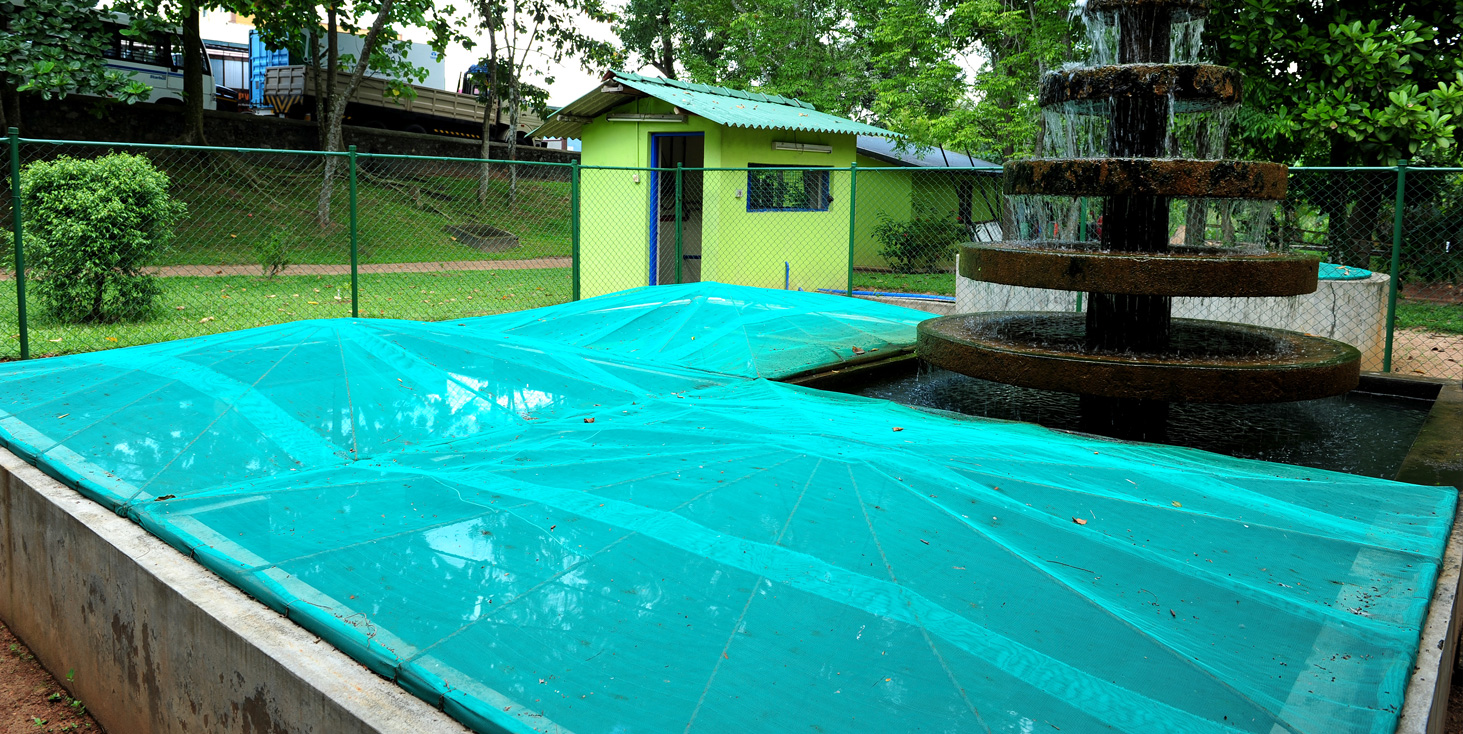
Water is a primary and indispensable input for our vehicle service and repair business, as well for daily use within our organization for domestic purposes. The effective measurement, management and recycling of the water used by our business helps us to cut costs and conserve a natural resource that is critical to society. Moreover, the treatment of water used in servicing before being released to the environment is essential in order to adhere to environmental guidelines and also to ensure that local communities and the environment are not adversely affected. Failure to execute such treatment would result in our business continuity coming into serious question. State-of-the-art water treatment/recycling plants are established at all the Company’s workshop sites and the recycled water is used for the Company’s activities.
Our main source of water is the national water supply and at certain business locations such as the Siyambalape workshop, the Weliweriya Logistics Centre and the premises at Colombo, ground water sources are explored to a certain extent. As we have increased our efforts to save water at our service facilities and in domestic usage, these water sources are not significantly affected.
Total Water Consumption, Recycle/Reuse and discharged
Description |
Water usage(M3) |
Reused water(M3) |
Reused percentage (%) |
||||||
2013/14 |
2012/13 |
2011/12 |
2013/14 |
2012/13 |
2011/12 |
2013/14 |
2012/13 |
2011/12 |
|
Municipal Water |
49,794 |
56,410 |
42,329 |
|
1,729 |
- |
|
|
- |
Ground water |
40,581 |
45,647 |
33,151 |
9,692 |
9,875 |
4,863 |
24 % |
21 % |
15 % |
Rain Water Harvesting |
112 |
194 |
160 |
|
|
|
|
|
|
Total |
90,487 |
102,251 |
75,640 |
9,692 |
11,604 |
3,991 |
11 % |
11% |
6 % |
Water consumption has increased during the year under review due to following reasons.
During the financial year, water consumption decreased by 11.5 % when compared to the previous financial year due to a decrease in municipal water consumption by 15% at the head office premises. The ground water consumed, 24 (21 % in FY 2012/13) has been recycled and reused. This amounts to 11% (11% in FY 2012/13) of the total water consumption. The recycled amount is increased due to the capacity of the water treatment plant at Siyambalape. The total volume of water reused at Siyambalape and Weliveriya is 9,692 m³. Of this, 4,917m³ has been used for vehicle washing purposes whilst the balance has been used for gardening purposes at both premises.
Waste Water Treatment
Dimo’s waste management processes prevent the discharge of untreated water into the sewage system. Waste water from all our workshops passes through oil separators and is monitored to ascertain its pH levels to ensure compliance with legal limits. The Company operates biological water treatment and recycling plants at the TATA Commercial Workshop/Construction Machinery Workshop at Siyambalape, and at the DIMO Logistic Centre in Weliveriya. Water treatment plants are also installed at the Mercedes Benz passenger car workshop, the TATA passenger car workshop in Colombo and at the branches of TATA Commercial Workshops in Ratnapura, Anuradhapura, Matara, Kurunegala, Kandy and Trincomalee.
In addition, a random sample of recycled water is collected by a Central Environmental Authority approved third party to check whether its pH Value, Chemical Oxygen Demand (COD), Biochemical Oxygen Demand, Total Suspended Solids and Oil/Grease content are below the tolerance levels required by the Central Environmental Authority. They have been found to be well below the stipulated tolerance levels.
During the year the water discharged through the treatment plants has been measured at our workshops located in Colombo, Siyambalape, Balagolla, Anuradhapura, Kuruwita and Weliveriya.
Water Discharged by Destination
Location |
Discharged volume (m³) |
|
2013-14 |
2012-13 |
|
Colombo car workshop |
650 |
1,438 |
Siyambalape Commercial vehicle workshop |
4,773 |
6,595 |
Balagolla (Kandy service) |
1,405 |
1,382 |
Anuradhapura |
297 |
97 |
Kuruwita |
116 |
291 |
Weliveriya |
1,077 |
1,801 |
Total |
8,318 |
11,604 |
EFFLUENTS AND WASTE
The measurement and management of effluents and waste are necessary because these activities help us evaluate the level of efficiency with which we operate our service centres. This approach also helps us gauge how environmentally friendly we are in our operations. Being able to recycle and reuse would help us cut down our costs while mitigating the adverse impacts we have on the environment. Efficient waste management plays a pivotal role in adhering to environmental regulations and ensuring that the local communities where we operate do not face any health hazards due to our business activities.
Our approach to the management of this issue involves organization-wide implementation of waste collection, storage and disposal processes. For the collection and management of waste, we segregate and categorize it into two main classes; hazardous and non-hazardous. The waste and effluents are further classified based on the type of treatment that they need to undergo for safe disposal. Overall, our waste management and disposal mechanisms across the Group are driven by our “Go-Green” concept with the support of all business units.
Non-Hazardous Solid Waste Management
Our systematised approach to effluent and waste segregation for non-hazardous solid waste involves the separation of material according to classifications such as organic material, paper, polythene and plastic. Colour coded bins are provided in dining areas to segregate food from wrapping material, as such disposed food is given to a third party for use as animal feed. (This refuse is delivered to the destination of disposal using specially designed vehicles provided by DIMO). We have formulated our own waste disposal system that does not burden the local authorities. We have contracted with Holcim Geocycle (a Central Environmental Authority accredited third party) to obtain a waste management solution for our hazardous and non-hazardous waste.
Our objective is to prepare a platform for the realization of a paperless office environment. Through organization-wide policies and initiatives, we actively work towards the reduction of paper usage and wastage in all our operations. A snapshot of our initiatives include an e-mail rider campaign discouraging the printing copies of e-mails unnecessarily, the use of recyclable paper bags at our sales outlets, maximising the use of paper (both sides as opposed to one-side used and dumped) and the recycling of printer cartridges.
Non-hazardous Solid waste disposal
Waste Category |
Quantity, Kg |
Method of Disposal |
||
2013/14 |
2012/13 |
2012/13 |
||
Organic |
33,307.0 |
34,417 |
48,033 |
To third party as animal feed |
Contaminated paper |
44,487.0 |
6788 |
5,390 |
To third party for recycling |
Cardboard boxes |
16,523.0 |
20,227 |
2,576 |
To third party for recycling |
Polythene |
5,259.0 |
3,388 |
2,577 |
To third party for recycling |
Plastic |
1,046.0 |
1,337 |
1,062 |
Collected as garbage by Local Authority |
Pallet racks |
33,875.0 |
63,854 |
5,730 |
To third party for recycling |
Organic waste generation and disposal has reduced during the year due to the campaigns aimed at reducing food waste. The quantity of A4 sized paper disposed has increased as the collection mechanism was streamlined and introduced at all locations. Waste consisting of cardboard boxes and pallet racks has decreased due to a reduction of goods shipped to the Group.
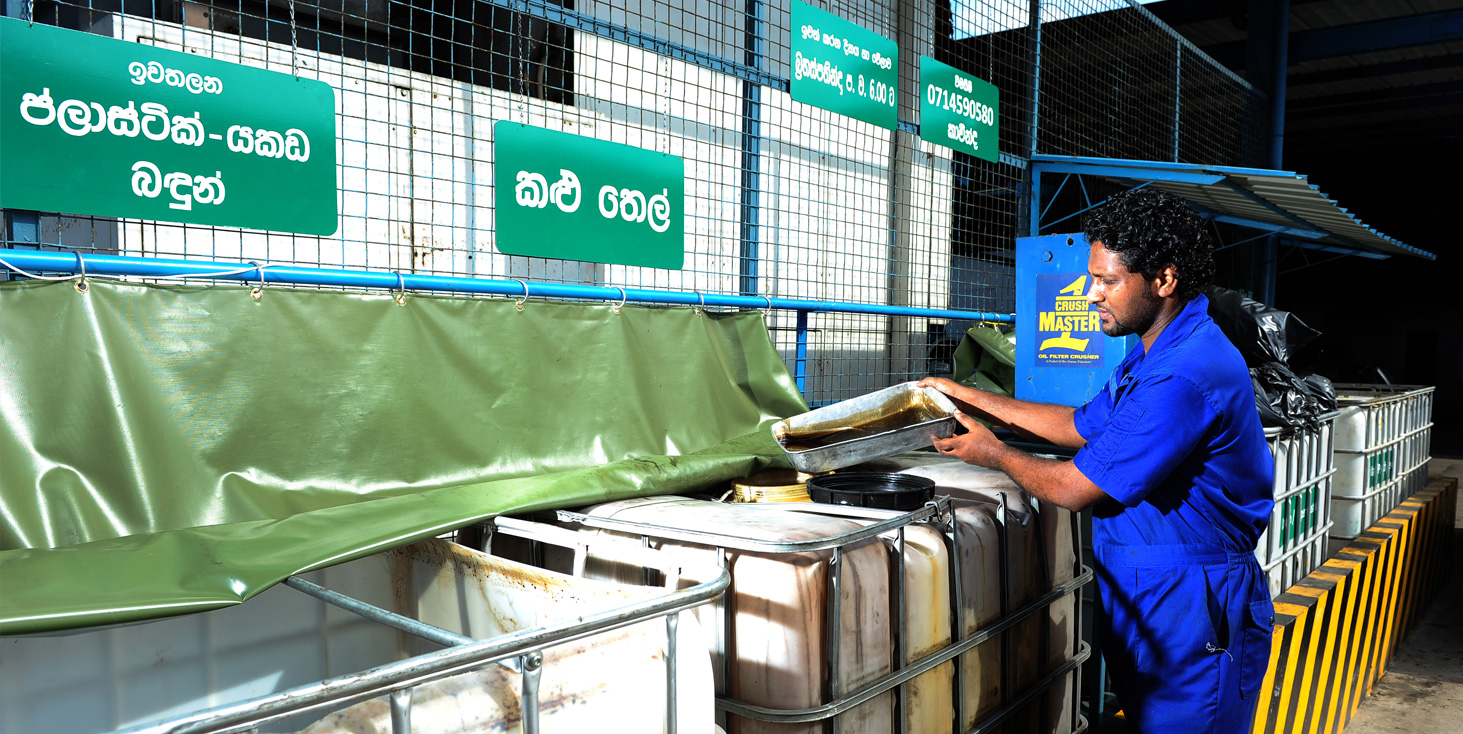
Hazardous Waste Management
Chemical spillage is non-existent at DIMO. A codified set of rules and guidelines is in place to deal with such an event and our staff is familiar with its execution.
Such a mechanism is in place to put into motion an effective response to eliminate or mitigate any damage. Equipment such as oil suckers are available to deal with spillages. Any waste generated is regularly handed over to designated third parties for recycling, while employees are regularly trained in safety-related measures and about the proper handling of material.
Hazardous Waste Disposal
Type of Waste |
Units |
Quantity Disposed |
Current Method of Disposal |
||
2013/14 |
2012/13 |
2012/13 |
|||
Waste oil* |
Litre |
107,146.0 |
131,803 |
104,762 |
Handed over to authorized third party for recycling |
Thinner |
Litre |
500.0 |
614 |
1,243 |
|
Sludge |
Kg |
90,390.0 |
70,723 |
57,454 |
|
Metal scrap |
Kg |
32,190.0 |
32,376 |
34,605 |
|
Metal dust |
Kg |
2,399.0 |
2,260 |
2,189 |
|
Paint cans |
No. |
893.0 |
1,117 |
933 |
|
Filters |
No. |
23,682.0 |
36,368 |
20,447 |
|
Batteries |
No. |
1,996.0 |
361 |
218 |
|
Tyres |
No. |
248.0 |
337 |
493 |
|
Saw Dust |
Kg |
174.0 |
147.5 |
19 |
|
* Waste oil includesengine oil from serviced vehicles and kerosene oil (small type)
Expenses incurred with regard to our water treatment, recycling plants, waste management and environmental audit amounted to Rs. 6.8 mn for the year under review (Rs. 8.41 mn in 2012/13).
NOISE MANAGEMENT
Noise emissions from all of the company’s facilities are strictly controlled to ensure that people in the vicinity of these locations are not subjected to uncomfortable noise levels. Noise levels are measured by the Central Environmental Authority. The company complies with the legal requirements pertaining to noise emission and is taking steps to ensure that its noise emissions are substantially below the legal requirements.
